Improving Overall Business Performance – A Planning Perspective
- Pamela Quintanilla Cupe

- Dec 18, 2022
- 7 min read
This project introduces a straightforward approach to improve overall business performance in specialty chemical industry. It solves the production planning problem applying the product wheel concept. By defining clear capacity allocation rules and balancing the trade-offs between capacity utilization, inventory, and cycle time, it addresses the challenge of matching demand supply.
Introduction
Supply chain management aims to deliver superior customer value at the less cost possible (Christopher, 2016). However, achieving higher customer value and low cost involves matching supply and demand, which represents a complex task for nearly every company worldwide. Often demand is volatile, and supply is constrained, while the overall exercise involves a meticulous balancing of capacity, inventory, and lead time. Two basic approaches have been applied to cope with the supply and demand matching problem. The first approach proposes the build-up of inventory to hedge against demand fluctuations. While rising stocks can potentially minimize the capacity investment requirements, it can also increase cycle time and costs. The second approach suggests expanding the capacity to produce on-demand. Whilst, this strategy would reduce inventory holding costs, it could increase capacity investment requirements and affect cycle time under fluctuations.

The emerging trade-offs resulting from these two approaches are known as the balancing act in supply chain and operations management. Finding the balance between capacity, inventory, and lead time is critical to addressing uncertainty and resolving the supply and demand mismatch.
Problem
The company of study is a specialty chemical company operating worldwide. The firm is organized into four business units (BU) and attends to the needs of multiple industries downstream. This project focuses on the operations of one of those BUs, and specifically on one product portfolio, for which the mismatch problem between supply and demand has been exacerbated over the last couple of years.

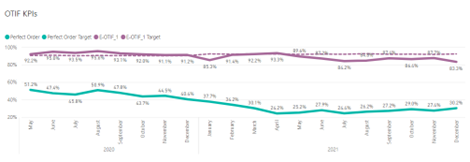
This increase in change requests has affected the overall performance of the milling network, reducing the capacity utilization to roughly 50% (technical capacity minus changeovers, planned stops, and other stops) and consequently increasing the changeover time. It has also negatively affected lead time, increasing the median by 90%. The percentage of orders delivered on time and as agreed with the customer (what is termed "perfect order") was, on average, about 29% during 2020 and 2021. Likewise, the overall equipment efficiency has been affected.
The situation described has prompted the main question to be addressed in this thesis: How to allocate and better utilize operational assets to improve overall business performance?
Methodology
The product wheel concept was applied through a six-step methodology to tackle the company's main question. By collecting data and performing a thorough analysis the pain points, bottlenecks, levers, key variables, and constraints were identified. Thereafter, an analysis of the demand was conducted to define a suitable replenishment strategy (MTO or MTS). As a third step, we analyzed the changeover complexity in-depth. Product wheels were designed by identifying the sequence, potential frequencies, and cycles. During the design phase, we carried out a heuristic iterative process to determine the balanced wheels, taking strategic and technical aspects into account. Finally, the impact on inventory was calculated and compared with the current policy in place.
Demand Variability and MTO vs. MTS Strategy
The demand for the last two years (2020 – 2021) has been analyzed to identify high and low-volume products, key customers, and strategic segments. Additionally, the relative variability has been determined by computing the coefficient of variation.


The relative variability computation helps us decide whether the product should follow an MTO or MTS strategy. Products with high relative variability (coefficient of variation) and low average demand should follow a make-to-order strategy. In contrast, products with low relative variability and high demand should be made to stock. Producing the highest and most stable demand products to stock provides a consistent baseload for the mills. Thus, enabling to level the production.
To help us decide the strategy, the matrix proposed by King & King (2013) has been applied.

As a result, only a few products could have been matched to a strategy. To meet a decision for the remaining products, the stability of the demand was assessed. Likewise, each product's percentages of the total demand and its importance to the key customers and segments were considered. Therefore, it was decided that 19 products would be made to stock and six made to order.

Mill – Product Allocation
Although the company has provided a list of products that can be produced in each mill, an analysis of the last two years' production has shown that the mills have been producing products that were not on the list. Therefore, the list was revised with the sponsoring company, and some considerations concerning the demand for certain products have been considered. As a result, the following mill-product allocation was defined:

Optimal Sequence
From a heuristic approach, identifying the optimal sequence essentially means finding the shortest path through the end of production. Finding the best sequence combination in mills where two or three products are manufactured is not complicated. By trying different combinations, the minimum sum of changeover time represents the optimal sequence. While for mills manufacturing more than three products, TSP has been applied. The problem was formulated to minimize the total changeover time. Likewise, the loss due to changeovers was estimated:

The time spent in changeovers could reach 67% of the available time if the theoretical optimal sequence is applied within a wheel. Hence, it is necessary to find an alternative that indeed reduces the changeover time.
Designing the Optimal Wheel
To solve the problem faced by the sponsor, all of the following influencing factors have been assessed:
- The economic wheel is based on the EOQ model.
- The actual inventory policy
- Minimum campaign size
- Prioritization of products.
Given that the minimum campaign size for different mill-product combinations varies defining the optimal wheel requires a heuristic approach that considers the precedent calculations as a base reference.
A heuristic approach based on an iterative process has been performed to decide the optimal product wheel. As a starting point, the output of the EOQ calculation for high-volume products was used.
Additionally, priorities have been defined considering the following aspects:
- Contribution margin (COMA)
- Growth rate
- Available mills to produce the same product
- Projected demand
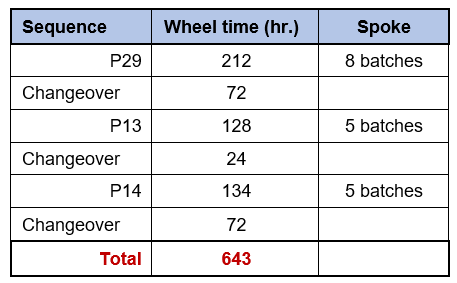
As an example, the optimal wheels for mill 11 are presented below:


Impact on Inventory
Implementing product wheels requires reviewing the inventory requirements upstream and downstream. On one side, MTS products require a stock nearly proportionally to the wheel time. While, theoretically, MTO products do not require stock, factors such as the minimum campaign size or MOQ (in this thesis) can force the company to keep some inventory.
On the other side, the effectiveness of the wheel also depends on the availability of raw material or, in this case, intermediates. Every time a cycle starts, raw materials need to be ready to use.
The inventory requirements for finished goods can be calculated through the following formula:

Considering the sponsoring company already has a policy in place, as addressed in chapter 6, a comparison between the inventory required (to implement the product wheel) and the average stock (2021) was made. The results indicate that the company's current cycle stock matches the product wheels requirements. However, two exceptions have been noticed. Two of the top sellers would require the company to increase its current cycle inventory. Nonetheless, these two products are manufactured in more than one mill, which could be translated into a lower frequency.
In addition to the cycle inventory requirements, the safety stock needs have also been evaluated. A service level of 95% was assumed to compute the safety stock requirements. The computation highlights the necessity to review the current policy since the actual safety stock does not match the wheel requirements.
Effect on Other Indicators
The product wheel offers the opportunity to identify accurate lead times that may trigger the policy toward the customers. High-volume products, for example, would be produced continuously. Hence, a lead time of two weeks is achievable. Even though low-volume products may require longer times, an accurate delivery period can be set. Likewise, minimum and maximum order quantities can be defined.
Moreover, long-term and collaborative agreements can be signed. Indeed, out of 400 customers, only 14 represent 80% of the total sales. Consequently, if an agreement is reached with them concerning lead times and quantities, 80% of the total demand could be known, opening the door for further improvements in the wheel concept, inventory policies, and capacity utilization and allocation.
Another factor or topic to consider is cost. Indistinctly to the company's industry, costs are expected to be the lowest possible. Reaching this goal involves driving continuous initiatives towards improvement, such as the product wheel itself. By minimizing the number of changeovers and determining minimum campaign sizes, it can be stated that costs will drop. However, the real impact needs to be measured with updated data. In addition, a complete picture of the costs associated with changeovers could help identify some trade-offs to apply under specific scenarios.
Conclusions
The problem addressed throughout this project is eventually the most common dilemma in the industry nowadays. Hence, it requires simple, practical, and straightforward solutions such as the proposed one in this thesis.
Despite the rise of AI, algorithms, and sophisticated technology solutions in supply chain applications, lean techniques offer simple solutions to complex problems that do not require significant investments or training. Product wheels are a clear example of this.
Given the complex production environment (variable production rates, multiple assets for a single product, etc.) of the sponsoring company, the solution proposed throughout this thesis provides a robust approach to face variability. As demonstrated, implementing product wheels would improve the utilization and performance of assets while keeping the product mix. Moreover, it offers the opportunity to reduce costs and improve the overall planning process.
Though the identification of frequencies and design of the wheels hasn't been easy and requires an in-depth analysis of the demand and production, the results are promising. Indeed, the sponsoring company can expect to level its production within relatively short periods, have clear visibility concerning the optimal sequences, find an economic balance between its inventory and changeover cost, and ultimately a less reactive and chaotic planning process.
Cited Sources
Christopher, M., 2016. Logistics & supply chain management. 5th ed. Harlow: Pearson Education (Always learning).
Kempf, K. G., Keskinocak, P. & Uzsoy, R., 2011. Planning Production and Inventories in the Extended Enterprise. A State of the Art Handbook, Volume 1. 1st ed. New York: Springer.
King, P. L. & King, J. S., 2013. The Product Wheel Handbook. 1st ed. New York: Taylor & Francis Group.


Comments